Overview
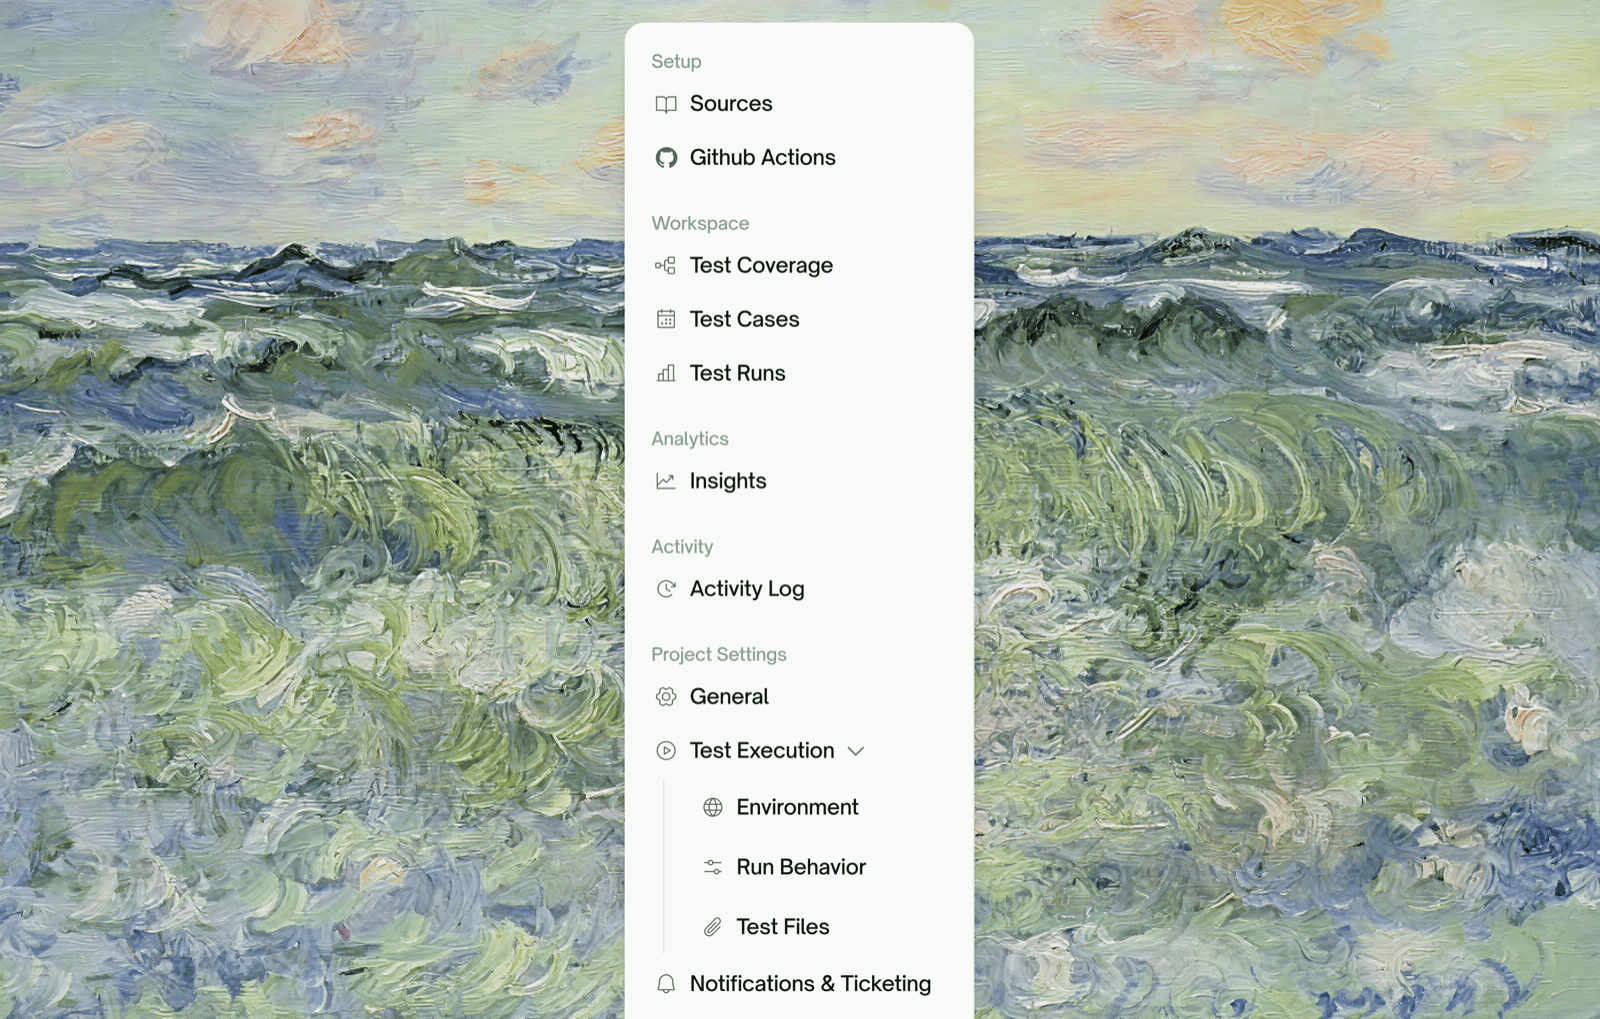
Every project (UI, API, or both) gets its own detail page at Dashboard → Tests → [your project] — the home base for its tests, runs, recordings, flows, credentials, and refinements. The visible tabs depend on project type: UI-only projects hide API tabs (Data Flow, Cleanup, Dynamic Variables, Integration Tests) and vice versa, with the core tabs shared.
Tabs at a Glance
Use Case Flow

- What it is
- When you'll use it
An interactive map of your features. Each feature is a node; each user-flow step under a feature is a sub-node. After a run, every step is colored by status — passed, failed, partially passing, or not yet covered.UI projects render this from the features TestSprite identified during exploration. API projects render it from features extracted from your PRD or instructions.
Data Flow (API only)

- What it is
- When you'll use it
Every HTTP call TestSprite made during the last run, grouped by endpoint. Each card shows the method, URL, status code, request body, and response body. Tests that capture variables (“produces”) and tests that consume them (“uses”) are linked across cards.
Site Exploration (UI only)

- What it is
- When you'll use it
A gallery of feature-by-feature explorations of your app — one tile per feature. Each tile shows the recording from that exploration and a short AI-authored summary of what was discovered.The status pill on each tile tells you whether exploration is still Exploring, Done, Failed, or Idle. While exploration is in flight you’ll see the live stream; afterward, a persisted recording.
Feature Exploration
How exploration works during the wizard
Endpoint Tests / Integration Tests

- What it is
- When you'll use it
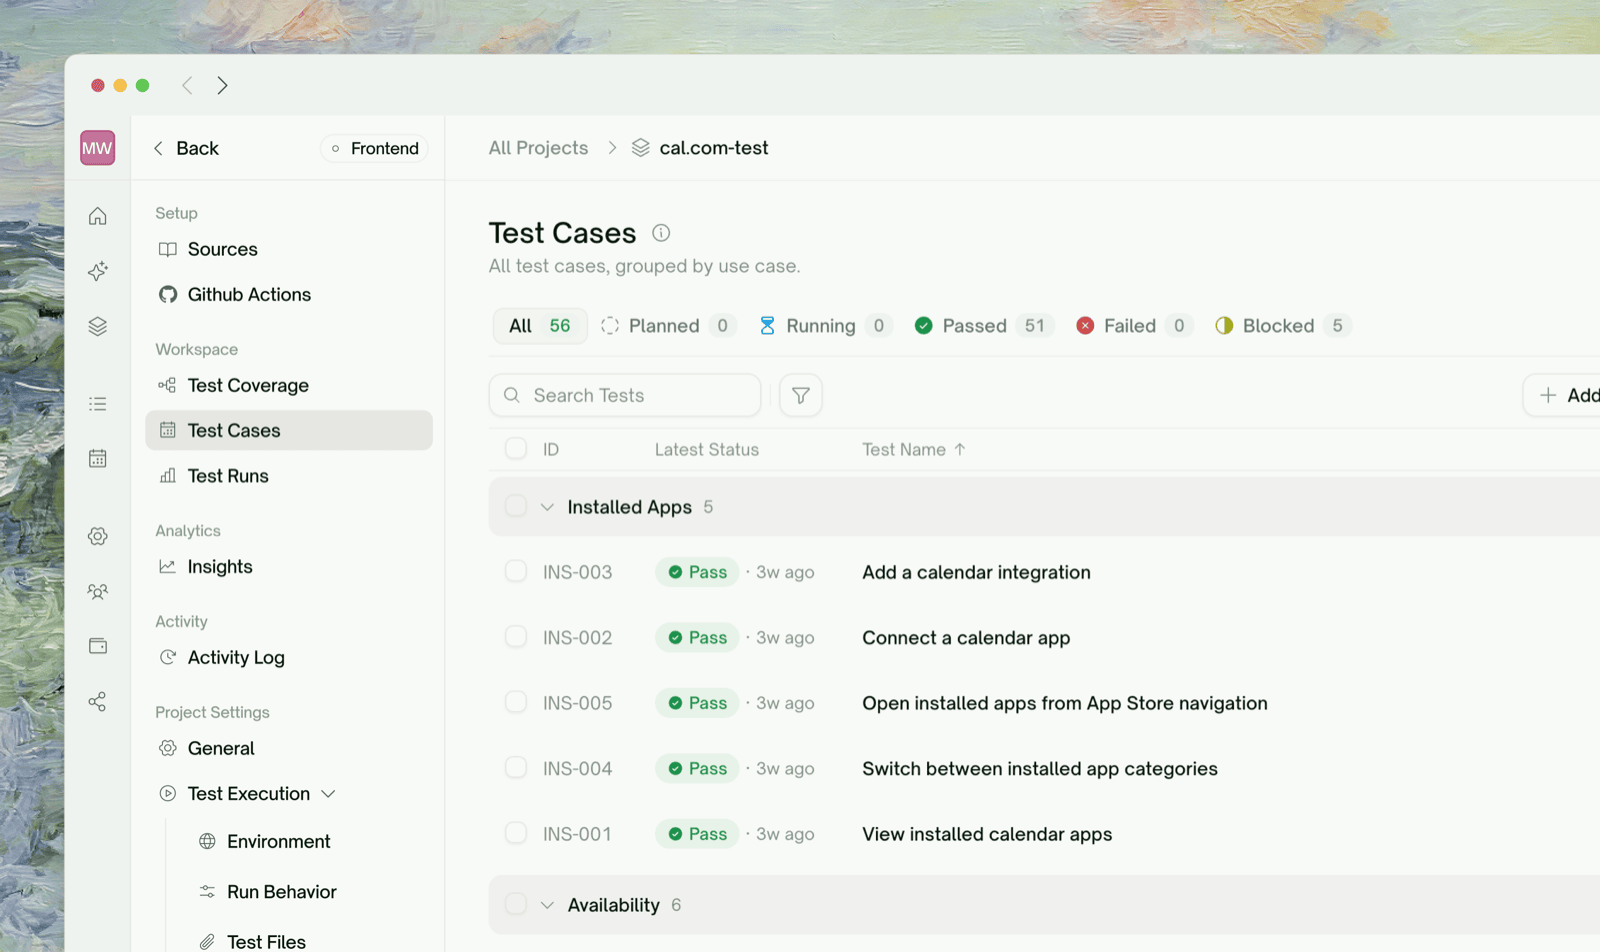
The flat list of every test case in this project. The label depends on type:
- UI projects call them Integration Tests — multi-step user journeys covering full flows
- API projects call them Endpoint Tests — typically per-endpoint checks
Integration Tests — Workflows (API only)

- What it is
- When you'll use it
Multi-step chains TestSprite identified across your tests when one endpoint’s response feeds another (e.g.
POST /orders produces an orderId that GET /orders/{id} then uses). Each row is a chain, executable as a single integration test.Cleanup (API only)

- What it is
- When you'll use it
A list of resources your tests created — records, files, sessions — with the status of each cleanup attempt. Resources marked Has cleanup were torn down successfully; Orphaned ones couldn’t be reached or had no clean teardown path.Cleanup runs automatically after every API run. You’ll see a “Running cleanup sweep” indicator briefly before the report finalizes.
Dynamic Variables (API only)

- What it is
- When you'll use it
The list of values one test captured and another test consumed, grouped by variable name. For each variable you’ll see the captured value(s) and which tests produce or use it.
Authentication

- What it is
- When you'll use it
The credentials TestSprite uses to call your APIs or sign into your app.For API projects: a per-API table with auth type (Bearer Token, API Key, Basic Token, None) and the masked secret value. APIs sharing the same auth type can be updated in bulk from a single row.For UI projects: a simpler form for the test account TestSprite uses during exploration (URL, username, password).All values are stored encrypted and shown masked — only the first 6 and last 4 characters of long secrets are visible.
Agent Actions (UI only)

- What it is
- When you'll use it
A video gallery of every UI test run. Each tile is the recording produced while TestSprite walked through one user journey. Click a tile to open the inline player.
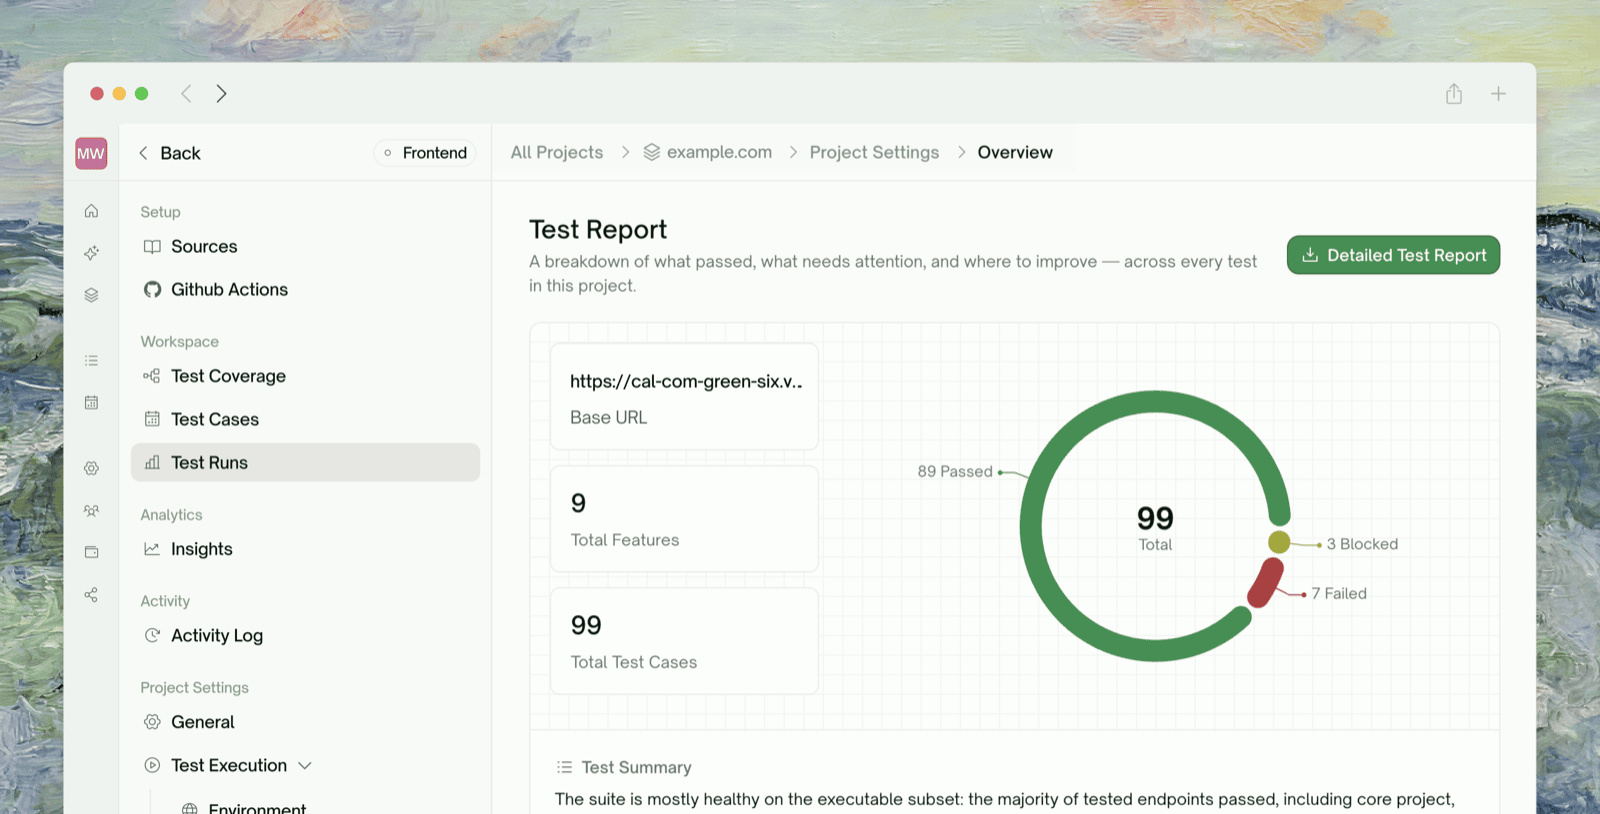
Test Report

- What it is
- When you'll use it
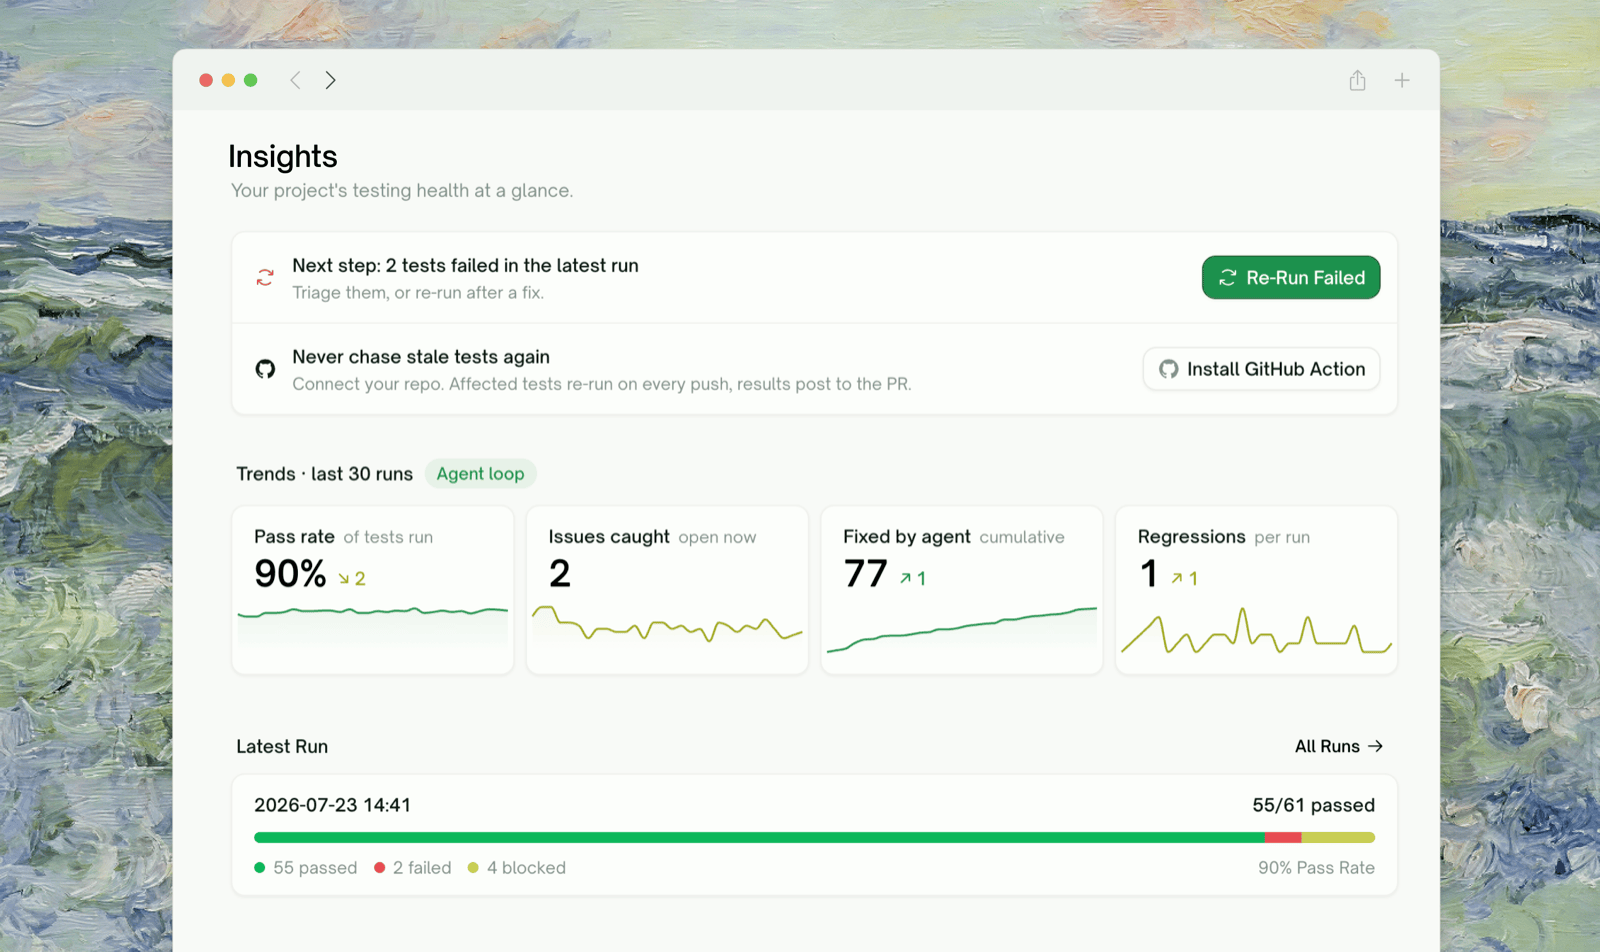
The run-level summary view: pass/fail counts, an AI-authored analysis of the run, highlighted failures with cause-and-fix suggestions, and quick links to the per-test reports.The nav badge on this tab shows two counts when relevant — red for Failed tests and amber for Blocked tests (setup or auth issues, distinct from a real product bug).
Refining Tests
How to iterate after reviewing the report
Inside a Test — Drill-Down View
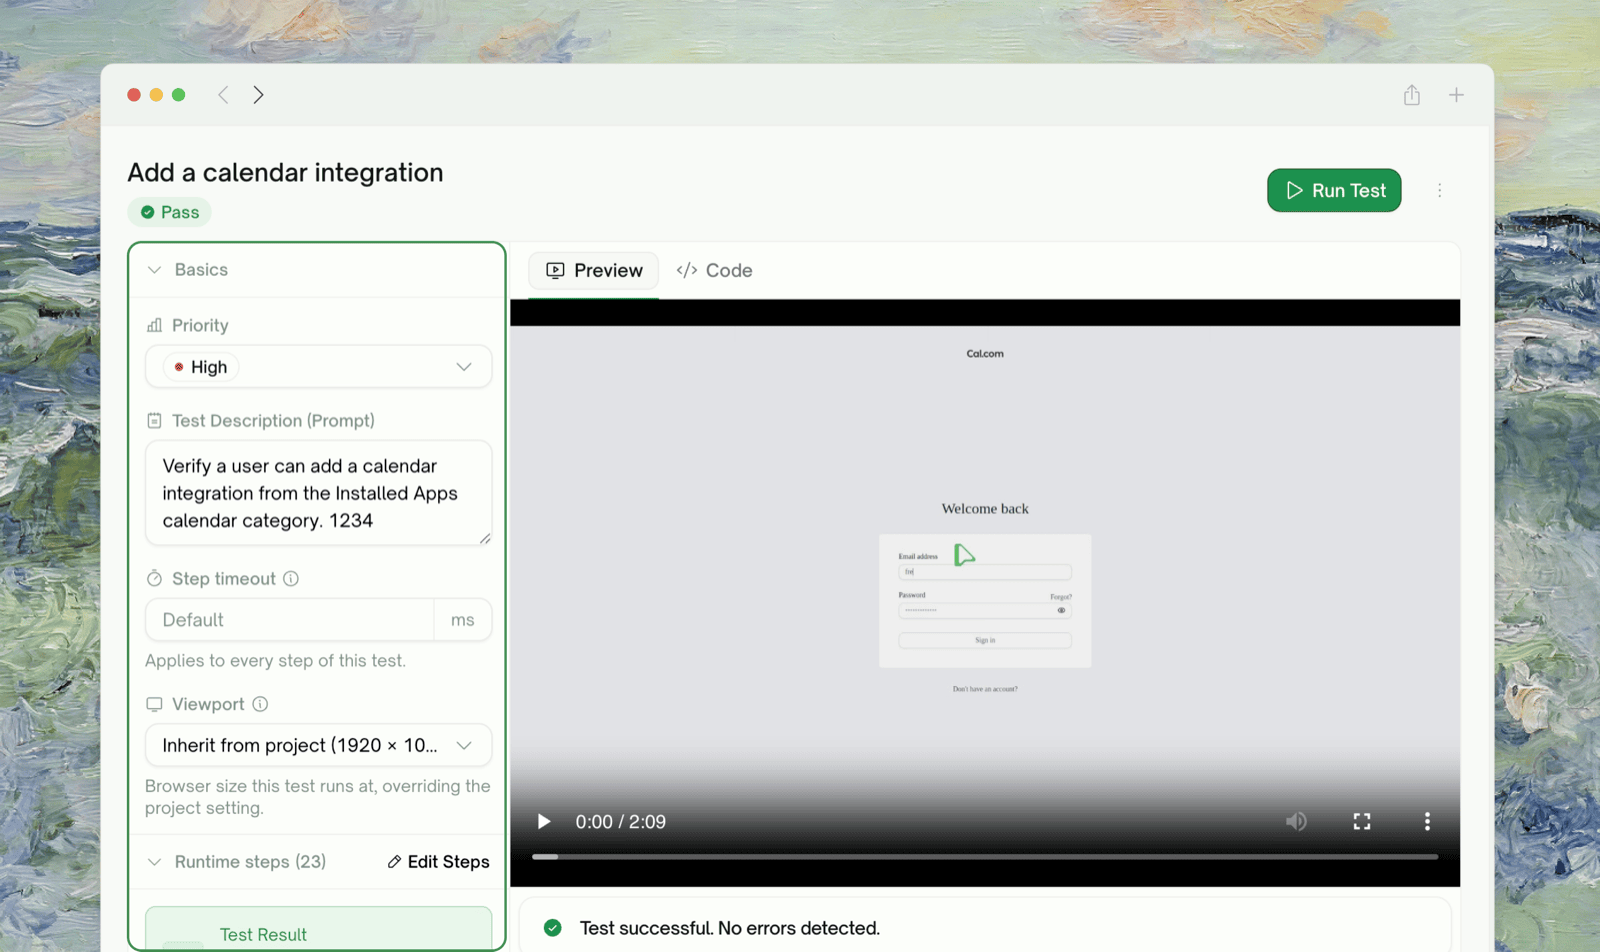
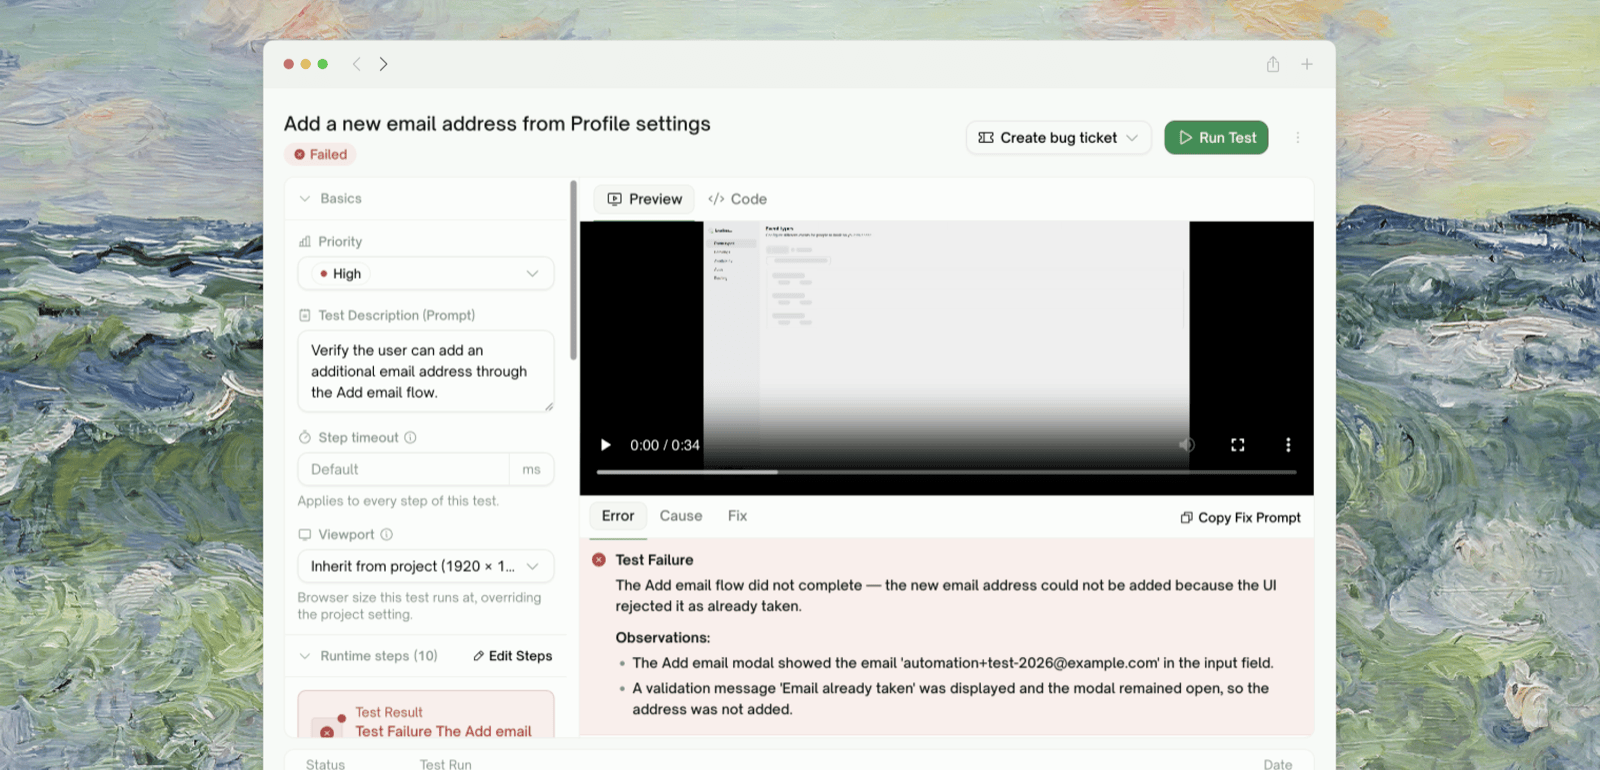
Clicking any row in the Endpoint Tests / Integration Tests list opens that test’s own detail page. The page is split into two panels:
Right panel — code and preview.
- UI tests show two tabs: Preview (recorded video of the run) and Code (the generated Playwright source).
- API tests show the code editor directly (generated Python).
Cmd/Ctrl+S saves without running.
The toolbar at the top of the per-test page is intentionally minimal:
Step-by-Step Walkthrough
The rich per-step replay view for UI tests
Settings Actions
The bottom of the left nav has two project-level actions that show up when applicable:Where to Go Next
UI Testing
Create a UI project from scratch
API Testing
Create an API project from scratch
Refining Tests
Improve a test after reviewing it
Comparing Runs
Track what changed between runs